
 What is a Z Score Table?
Contents
Definition: A Z-Score table or chart, often called a standard normal table in statistics, is a math chart used to calculate the area under a normal bell curve for a binomial normal distribution.
Z-tables help graphically display the percentage of values above or below a z-score in a group of data or data set.
In other words, Z tables help compare data points within a group and show what percentage they are above or below the group average.
What is a Z-Score?
The Z score itself is a statistical measurement of the number of standard deviations from the mean of a normal distribution.
In the world of statistics, numbers and data are gathered, organized and compared in order to derive information and patterns. One of the ways that this is done is by the use of the z-score. A z-score is a way to compare a raw score or data point to the mean, or the average, by using standard deviations.
What is a Standard Deviation?
The standard deviation is a measure of the amount of variation in a set of values. If the numbers have a large range, or the difference between the largest and smallest value, then it will have a high standard deviation.
If the range is smaller the set of data will have a low standard deviation.
Positive vs Negative Z Tables
The Z-score value can either positive or negative indicating that sample lies above or below the mean by a measure of standard deviations.
Thus, if the value is above the mean then the z-score is positive. If the value is below the mean, it is negative.
What is a Negative Z-Score Table?
A negative z-score has a value that is below or to the left of the mean of the standard normal distribution. Thus, a negative Z table displays Z values less than zero.
Negative Z Score Table / Chart
|
Z Value |
0.09 |
0.08 |
0.07 |
0.06 |
0.05 |
0.04 |
0.03 |
0.02 |
0.01 |
0.0 |
| -3.4 | 0.0002 | 0.0003 | 0.0003 | 0.0003 | 0.0003 | 0.0003 | 0.0003 | 0.0003 | 0.0003 | 0.0003 |
| -3.3 | 0.0003 | 0.0004 | 0.0004 | 0.0004 | 0.0004 | 0.0004 | 0.0004 | 0.0005 | 0.0005 | 0.0005 |
| -3.2 | 0.0005 | 0.0005 | 0.0005 | 0.0006 | 0.0006 | 0.0006 | 0.0006 | 0.0006 | 0.0007 | 0.0007 |
| -3.1 | 0.0007 | 0.0007 | 0.0008 | 0.0008 | 0.0008 | 0.0008 | 0.0009 | 0.0009 | 0.0009 | 0.0010 |
| -3.0 | 0.0010 | 0.0010 | 0.0011 | 0.0011 | 0.0011 | 0.0012 | 0.0012 | 0.0013 | 0.0013 | 0.0013 |
| -2.9 | 0.0014 | 0.0014 | 0.0015 | 0.0015 | 0.0016 | 0.0016 | 0.0017 | 0.0018 | 0.0018 | 0.0019 |
| -2.8 | 0.0019 | 0.0020 | 0.0021 | 0.0021 | 0.0022 | 0.0023 | 0.0023 | 0.0024 | 0.0025 | 0.0026 |
| -2.7 | 0.0026 | 0.0027 | 0.0028 | 0.0029 | 0.0030 | 0.0031 | 0.0032 | 0.0033 | 0.0034 | 0.0035 |
| -2.6 | 0.0036 | 0.0037 | 0.0038 | 0.0039 | 0.0040 | 0.0041 | 0.0043 | 0.0044 | 0.0045 | 0.0047 |
| -2.5 | 0.0048 | 0.0049 | 0.0051 | 0.0052 | 0.0054 | 0.0055 | 0.0057 | 0.0059 | 0.0060 | 0.0062 |
| -2.4 | 0.0064 | 0.0066 | 0.0068 | 0.0069 | 0.0071 | 0.0073 | 0.0075 | 0.0078 | 0.0080 | 0.0082 |
| -2.3 | 0.0084 | 0.0087 | 0.0089 | 0.0091 | 0.0094 | 0.0096 | 0.0099 | 0.0102 | 0.0104 | 0.0107 |
| -2.2 | 0.0110 | 0.0113 | 0.0116 | 0.0119 | 0.0122 | 0.0125 | 0.0129 | 0.0132 | 0.0136 | 0.0139 |
| -2.1 | 0.0143 | 0.0146 | 0.0150 | 0.0154 | 0.0158 | 0.0162 | 0.0166 | 0.0170 | 0.0174 | 0.0179 |
| -2.0 | 0.0183 | 0.0188 | 0.0192 | 0.0197 | 0.0202 | 0.0207 | 0.0212 | 0.0217 | 0.0222 | 0.0228 |
| -1.9 | 0.0233 | 0.0239 | 0.0244 | 0.0250 | 0.0256 | 0.0262 | 0.0268 | 0.0274 | 0.0281 | 0.0287 |
| -1.8 | 0.0294 | 0.0301 | 0.0307 | 0.0314 | 0.0322 | 0.0329 | 0.0336 | 0.0344 | 0.0351 | 0.0359 |
| -1.7 | 0.0367 | 0.0375 | 0.0384 | 0.0392 | 0.0401 | 0.0409 | 0.0418 | 0.0427 | 0.0436 | 0.0446 |
| -1.6 | 0.0455 | 0.0465 | 0.0475 | 0.0485 | 0.0495 | 0.0505 | 0.0516 | 0.0526 | 0.0537 | 0.0548 |
| -1.5 | 0.0559 | 0.0571 | 0.0582 | 0.0594 | 0.0606 | 0.0618 | 0.0630 | 0.0643 | 0.0655 | 0.0668 |
| -1.4 | 0.0681 | 0.0694 | 0.0708 | 0.0721 | 0.0735 | 0.0749 | 0.0764 | 0.0778 | 0.0793 | 0.0808 |
| -1.3 | 0.0823 | 0.0838 | 0.0853 | 0.0869 | 0.0885 | 0.0901 | 0.0918 | 0.0934 | 0.0951 | 0.0968 |
| -1.2 | 0.0985 | 0.1003 | 0.1020 | 0.1038 | 0.1056 | 0.1075 | 0.1093 | 0.1112 | 0.1131 | 0.1151 |
| -1.1 | 0.1170 | 0.1190 | 0.1210 | 0.1230 | 0.1251 | 0.1271 | 0.1292 | 0.1314 | 0.1335 | 0.1357 |
| -1.0 | 0.1379 | 0.1401 | 0.1423 | 0.1446 | 0.1469 | 0.1492 | 0.1515 | 0.1539 | 0.1562 | 0.1587 |
| -0.9 | 0.1611 | 0.1635 | 0.1660 | 0.1685 | 0.1711 | 0.1736 | 0.1762 | 0.1788 | 0.1814 | 0.1841 |
| -0.8 | 0.1867 | 0.1894 | 0.1922 | 0.1949 | 0.1977 | 0.2005 | 0.2033 | 0.2061 | 0.2090 | 0.2119 |
| -0.7 | 0.2148 | 0.2177 | 0.2206 | 0.2236 | 0.2266 | 0.2296 | 0.2327 | 0.2358 | 0.2389 | 0.2420 |
| -0.6 | 0.2451 | 0.2483 | 0.2514 | 0.2546 | 0.2578 | 0.2611 | 0.2643 | 0.2676 | 0.2709 | 0.2743 |
| -0.5 | 0.2776 | 0.2810 | 0.2843 | 0.2877 | 0.2912 | 0.2946 | 0.2981 | 0.3015 | 0.3050 | 0.3085 |
| -0.4 | 0.3121 | 0.3156 | 0.3192 | 0.3228 | 0.3264 | 0.3300 | 0.3336 | 0.3372 | 0.3409 | 0.3446 |
| -0.3 | 0.3483 | 0.3520 | 0.3557 | 0.3594 | 0.3632 | 0.3669 | 0.3707 | 0.3745 | 0.3783 | 0.3821 |
| -0.2 | 0.3829 | 0.3897 | 0.3936 | 0.3974 | 0.4013 | 0.4052 | 0.4090 | 0.4129 | 0.4168 | 0.4207 |
| -0.1 | 0.4247 | 0.4286 | 0.4325 | 0.4364 | 0.4404 | 0.4443 | 0.4483 | 0.4522 | 0.4562 | 0.4602 |
| -0.0 | 0.4641 | 0.4681 | 0.4721 | 0.4761 | 0.4801 | 0.4840 | 0.4880 | 0.4920 | 0.4960 | 0.5000 |
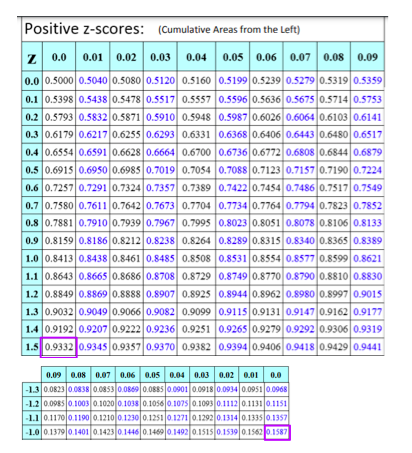
What is a Positive Z-Score Table?
A positive z-score has a value that is above or to the right of the mean of the standard normal distribution. Thus, a positive Z table displays Z values greater than zero.
Positive Z Score Table / Chart
|
Z Value |
0.0 |
0.01 |
0.02 |
0.03 |
0.04 |
0.05 |
0.06 |
0.07 |
0.08 |
0.09 |
| 0.0 | 0.5000 | 0.5040 | 0.5080 | 0.5120 | 0.5160 | 0.5199 | 0.5239 | 0.5279 | 0.5319 | 0.5359 |
| 0.1 | 0.5398 | 0.5438 | 0.5478 | 0.5517 | 0.5557 | 0.5596 | 0.5636 | 0.5675 | 0.5714 | 0.5753 |
| 0.2 | 0.5793 | 0.5832 | 0.5871 | 0.5910 | 0.5948 | 0.5987 | 0.6026 | 0.6064 | 0.6103 | 0.6141 |
| 0.3 | 0.6179 | 0.6217 | 0.6255 | 0.6293 | 0.6331 | 0.6368 | 0.6406 | 0..6443 | 0.6480 | 0.6517 |
| 0.4 | 0.6554 | 0.6591 | 0.6628 | 0.6664 | 0.6700 | 0.6736 | 0.6772 | 0.6808 | 0.6844 | 0.6879 |
| 0.5 | 0.6915 | 0.6950 | 0.6985 | 0.7019 | 0.7054 | 0.7088 | 0.7123 | 0.7157 | 0.7190 | 0.7224 |
| 0.6 | 0.7257 | 0.7291 | 0.7324 | 0.7357 | 0.7389 | 0.7422 | 0.7454 | 0.7486 | 0.7517 | 0.7549 |
| 0.7 | 0.7580 | 0.7611 | 0.7642 | 0.7673 | 0.7704 | 0.7734 | 0.7764 | 0.7794 | 0.7823 | 0.7852 |
| 0.8 | 0.7881 | 0.7910 | 0.7939 | 0.7967 | 0.7995 | 0.8023 | 0.8051 | 0.8078 | 0.8106 | 0.8133 |
| 0.9 | 0.8159 | 0.8186 | 0.8212 | 0.8238 | 0.8264 | 0.8289 | 0.8315 | 0.8340 | 0.8365 | 0.8389 |
| 1.0 | 0.8413 | 0.8438 | 0.8461 | 0.8485 | 0.8508 | 0.8531 | 0.8554 | 0.8577 | 0.8599 | 0.8621 |
| 1.1 | 0.8643 | 0.8665 | 0.8686 | 0.8708 | 0.8729 | 0.8749 | 0.8770 | 0.8790 | 0.8810 | 0.8830 |
| 1.2 | 0.8849 | 0.8869 | 0.8888 | 0.8907 | 0.8925 | 0.8944 | 0.8962 | 0.8980 | 0.8997 | 0.9015 |
| 1.3 | 0.9032 | 0.9049 | 0.9066 | 0.9082 | 0.9099 | 0.9115 | 0.9131 | 0.9147 | 0.9162 | 0.9177 |
| 1.4 | 0.9192 | 0.9207 | 0.9222 | 0.9236 | 0.9251 | 0.9265 | 0.9279 | 0.9292 | 0.9306 | 0.9319 |
| 1.5 | 0.9332 | 0.9345 | 0.9357 | 0.9370 | 0.9382 | 0.9394 | 0.9406 | 0.9418 | 0.9429 | 0.9441 |
| 1.6 | 0.9452 | 0.9463 | 0.9474 | 0.9484 | 0.9495 | 0.9505 | 0.9515 | 0.9525 | 0.9535 | 0.9545 |
| 1.7 | 0.9554 | 0.9564 | 0.9573 | 0.9582 | 0.9591 | 0.9599 | 0.9608 | 0.9616 | 0.9625 | 0.9633 |
| 1.8 | 0.9641 | 0.9649 | 0.9656 | 0.9664 | 0.9671 | 0.9678 | 0.9686 | 0.9693 | 0.9699 | 0.9706 |
| 1.9 | 0.9713 | 0.9719 | 0.9726 | 0.9732 | 0.9738 | 0.9744 | 0.9750 | 0.9756 | 0.9761 | 0.9767 |
| 2.0 | 0.9772 | 0.9778 | 0.9783 | 0.9788 | 0.9793 | 0.9798 | 0.9803 | 0.9808 | 0.9812 | 0.9817 |
| 2.1 | 0.9821 | 0.9826 | 0.9830 | 0.9834 | 0.9838 | 0.9842 | 0.9846 | 0.9850 | 0.9854 | 0.9857 |
| 2.2 | 0.9861 | 0.9864 | 0.9868 | 0.9871 | 00.9875 | 0.9878 | 0.9881 | 0.9884 | 0.9887 | 0.9890 |
| 2.3 | 0.9893 | 0.9896 | 0.9898 | 0.9901 | 0.9904 | 0.9906 | 0.9909 | 0.9911 | 0.9913 | 0.9916 |
| 2.4 | 0.9918 | 0.9920 | 0.9922 | 0.9925 | 0.9927 | 0.9929 | 0.9931 | 0.9932 | 0.9934 | 0.9936 |
| 2.5 | 0.9938 | 0.9940 | 0.9941 | 0.9943 | 0.9945 | 0.9946 | 0.9948 | 0.9949 | 0.9951 | 0.9952 |
| 2.6 | 0.9953 | 0.9955 | 0.9956 | 0.9957 | 0.9959 | 0.9960 | 0.9961 | 0.9962 | 0.9963 | 0.9964 |
| 2.7 | 0.9965 | 0.9966 | 0.9967 | 0.9968 | 0.9969 | 0.9970 | 0.9971 | 0.9972 | 0.9973 | 0.9974 |
| 2.8 | 0.9974 | 0.9975 | 0.9976 | 0.9977 | 0.9977 | 0.9978 | 0.9979 | 0.9979 | 0.9980 | 0.9981 |
| 2.9 | 0.9981 | 0.9982 | 0.9982 | 0.9983 | 0.9984 | 0.9984 | 0.9985 | 0.9985 | 0.9986 | 0.9986 |
| 3.0 | 0.9987 | 0.9987 | 0.9987 | 0.9988 | 0.9988 | 0.9989 | 0.9989 | 0.9989 | 0.9990 | 0.9990 |
| 3.1 | 0.9990 | 0.9991 | 0.9991 | 0.9991 | 0.9992 | 0.9992 | 0.9992 | 0.9992 | 0.9993 | 0.9993 |
| 3.2 | 0.9993 | 0.9993 | 0.9994 | 0.9994 | 0.9994 | 0.9994 | 0.9994 | 0.9995 | 0.9995 | 0.9995 |
| 3.3 | 0.9995 | 0.9995 | 0.9995 | 0.9996 | 0.9996 | 0.9996 | 0.9996 | 0.9996 | 0.9996 | 0.9997 |
| 3.4 | 0.9997 | 0.9997 | 0.9997 | 0.9997 | 0.9997 | 0.9997 | 0.9997 | 0.9997 | 0.9997 | 0.9998 |
Z Table Formula
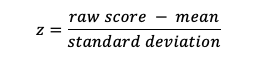
In order to find the z-score the mean is subtracted from the raw score and that value is divided by the standard deviation. In formula terms:
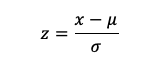
The z-score formula is often seen using symbols:
The z-score is important since it gives a standard number that indicates if the value of a score will land in the standard normal distribution. It also allows data from different sets to be compared that may have different means or standard deviations.
An example would be looking at peoples weights. Different age, race, and gender groups will have different means in the population. When a raw score is looked at as a z-score, they can now be compared to across multiple populations.
Once a z-score is calculated it can be used to determine the percentage of the area under a normal curve. Let’s use an example to look at how this is used and why it is important.
How to Read Z Score Tables
Example
Let’s find the probability that a variable has a z-score less than 0.42. Looking at a z-table we will use the vertical axis to find 0.4 and the horizontal axis to find the value 0.02.
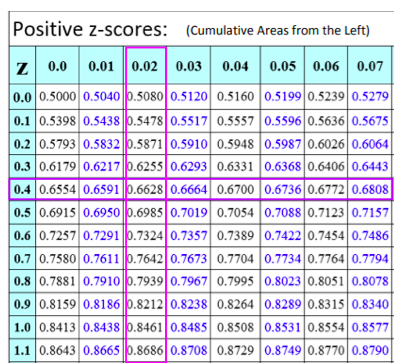
The value 0.6628 tells us that 66.28% of the curve is to the left of a z-score of 0.42. This means that 66.28% of scores are lower than the original value and 33.72% of the values are higher than the original value.
A population has an average test score of 75 with a standard deviation of 5. Find the percentage of scores before a test score of 83. With this example we have the following information.
- Mean: 75
- Standard deviation: 5
- Raw score: 83
First we need to find the z-score.
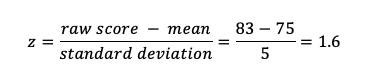
Find the z-score in the chart:
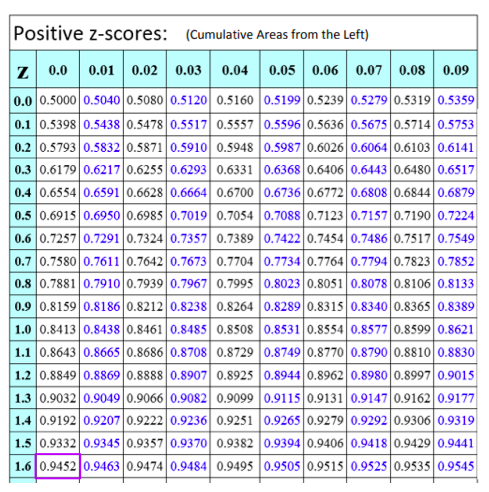
This tells us that 94.52% of the scores are below 83. This also means that 5.48% are higher.
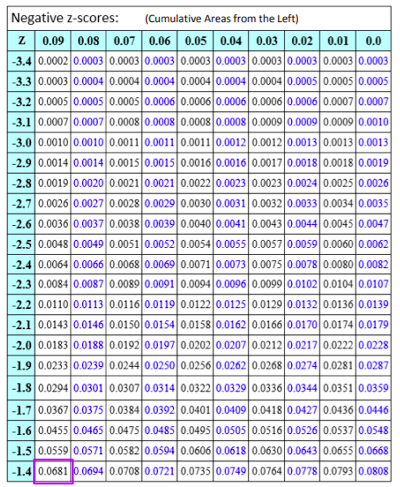
Let’s use the same values but with a score of 68.
- Mean: 75
- Standard deviation: 5
- Raw score: 68
First we need to find the z-score.
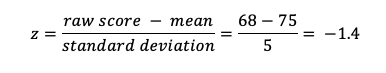
Notice that the z-score is negative. The raw score is below the mean. Due to the fact that we have a negative z-score, we will need to use a z score table that has negative values.
A score of 68 only has 6.81% of scores below it and 93.19% of scores are higher than it.
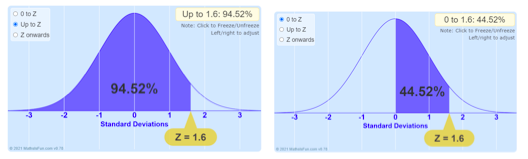
The z-score tables that have been used show “cumulative areas to the left. There are some tables that show the area from the mean. This would make a big difference in the data collected if the table is misinterpreted. The original z-score of 1.6 gave us a 94.52%. This is shown in the first graph.
The area of the curve is all to the left of the score. However, the second graph shows a percentage of only 44.52%. This is because it is only giving the percent of the curve from the mean to the z-score.
Since the mean is the middle of the normal distribution, we know that 50% of the curve is to the left of the mean. If you add 50% to the 44.52% you get the original percentage of 94.52%.
How to Use a Z Table
Example
Let’s do one more z-score chart example. Given a population has a mean score of 74 with a standard deviation of 4, what percentage of the population will have scores between 70 and 80?
First we will need to find the z-score of each of the scores of 70 and 80.
- Mean: 74
- Standard deviation: 4
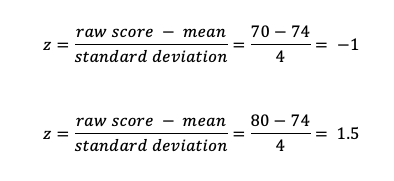
Next we use the Z charts to find the percentages.
- Area to the left of a score of 80: 0.9332
- Area to the left of a score of 70: 0.1587
To find the area between, subtract the values. 0.9332-0.1587 = 0.7745
77.45% of scores will fall between 70 and 80.