
 What is a Box and Whisker Plot?
Contents
A Box and whisker plot is a chart that displays mathematical data visually using bars and shapes. Most people are visual learners and having a way to analyze the data in a visual manner instead of as a list of numbers can be helpful and informative.
Displaying information graphically in a box plot can not only help people understand it easier, it can also help you look at the data differently.
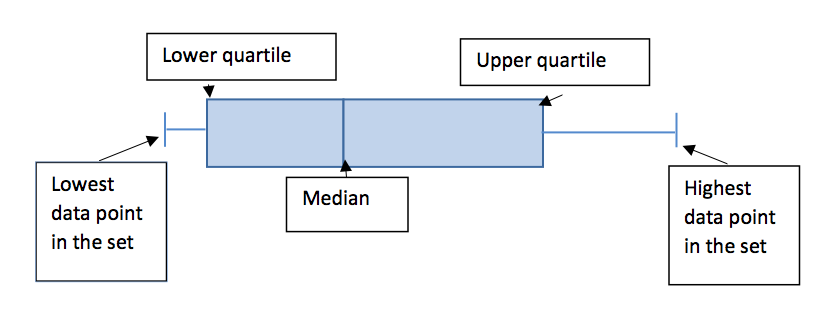
Box Whisker Plot Terms Explained
Some of the vocabulary with box and whisker plots:
Data Point: Each recorded number of the set of data is a data point.
Median: The middle number of the set of data. If there are an even amount of data points, the two middle numbers are averaged.
Lower Quartile, sometimes called the first quartile: The median of the lower set of numbers
Upper Quartile, sometimes called the third quartile: The median of the higher set of numbers
How to Make a Box and Whisker Plot Example
Step #1 – How to find median:
Order the data points from least to greatest. Find the middle number. If there are an even amount of data points, average the two middle points to find the median.
Step #2 – How to find lower quartile:
Order the data points from least to greatest. Split the data set in half. If there are an odd amount of data points, do not include the median. Find the median of the first half, smallest values, of the data points.
Step #3 – How to find upper quartile:
Order the data points from least to greatest. Split the data set in half. If there are an odd amount of data points, do not include the median. Find the median of the second half, highest values, of the data points.
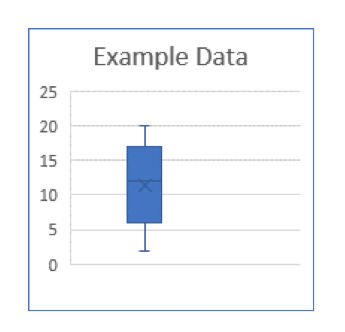
How to Read a Box and Whisker Plot
Data set:
6, 2, 16, 5, 8, 20, 14, 19, 6, 12, 7, 15, 18
Order from least to greatest:
2, 5, 6, 6, 7, 8, 12, 14, 15, 16, 18, 19, 20
Lowest data point:
2
Highest data point:
20
Median:
2, 5, 6, 6, 7, 8, 12, 14, 15, 16, 18, 19, 20
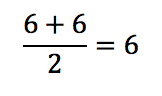
Lower Quartile:
Use only first half (2, 5, 6, 6, 7, 8)
2, 5, 6, 6, 7, 8
Find the average of the two middle numbers
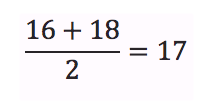
Upper Quartile:
Use only second half (14, 15, 16, 18, 19, 20)
14, 15, 16, 18, 19, 20
Find the average of the two middle numbers
Why is Box Whisker Plot Important in Math?
By using a box and whiskers plot it shows variability or where the different data points lie in comparison to the quartiles. If there are long whiskers that would show that the highest/lowest data points are far from the other data points. Depending on how long the boxes are shows how spread out the different quartiles are.
For example if the lower quartile is 3, the median is 5 and the upper quartile is 10, that shows that the lower numbers have less of a range than the higher numbers or that there are more repeating data points. It would not be as useful with data points that often repeat, for example ages of students in high school.
How to Create a Box and Whisker Plot in Excel
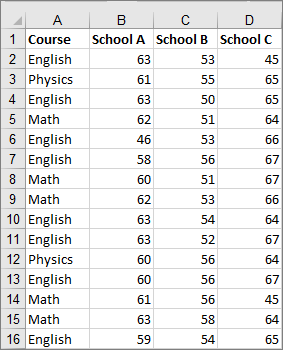
Step #1 Select Your Data
First, you will want to highlight the data that you are using to create your box and whisker chart in excel.
Step #2 Select Box and Whisker
On the top ribbon panel, you can click the insert tab. Once the insert tab is selected, you will see the statistical chart icon ( it looks like this ). Then click the Box and Whisker option.
Step #3 Customize Your Chart
After you have selected the chart, you can click the format option to change the colors, size, font, and other characteristics of your excel chart.
Box and Whisker Plot Calculator
Calculating and graphing a box whisker plot chart is easy without a calculator. You can simply use excel as your box whisker calculator using the instructions above.